How-To Guides
How to render paragraphs
Template
How to replace the whole text of a paragraph
If you want to replace the whole text of the shape, you just need to define a dictionary, with the name of the shape as the key, and the text you want to render as the value.
Code:
>>> values = {
...     'slide_title': "Cool insight",
... }

>>> render_and_save_template('__template__.pptx', values, 'rendered_ppt.pptx')
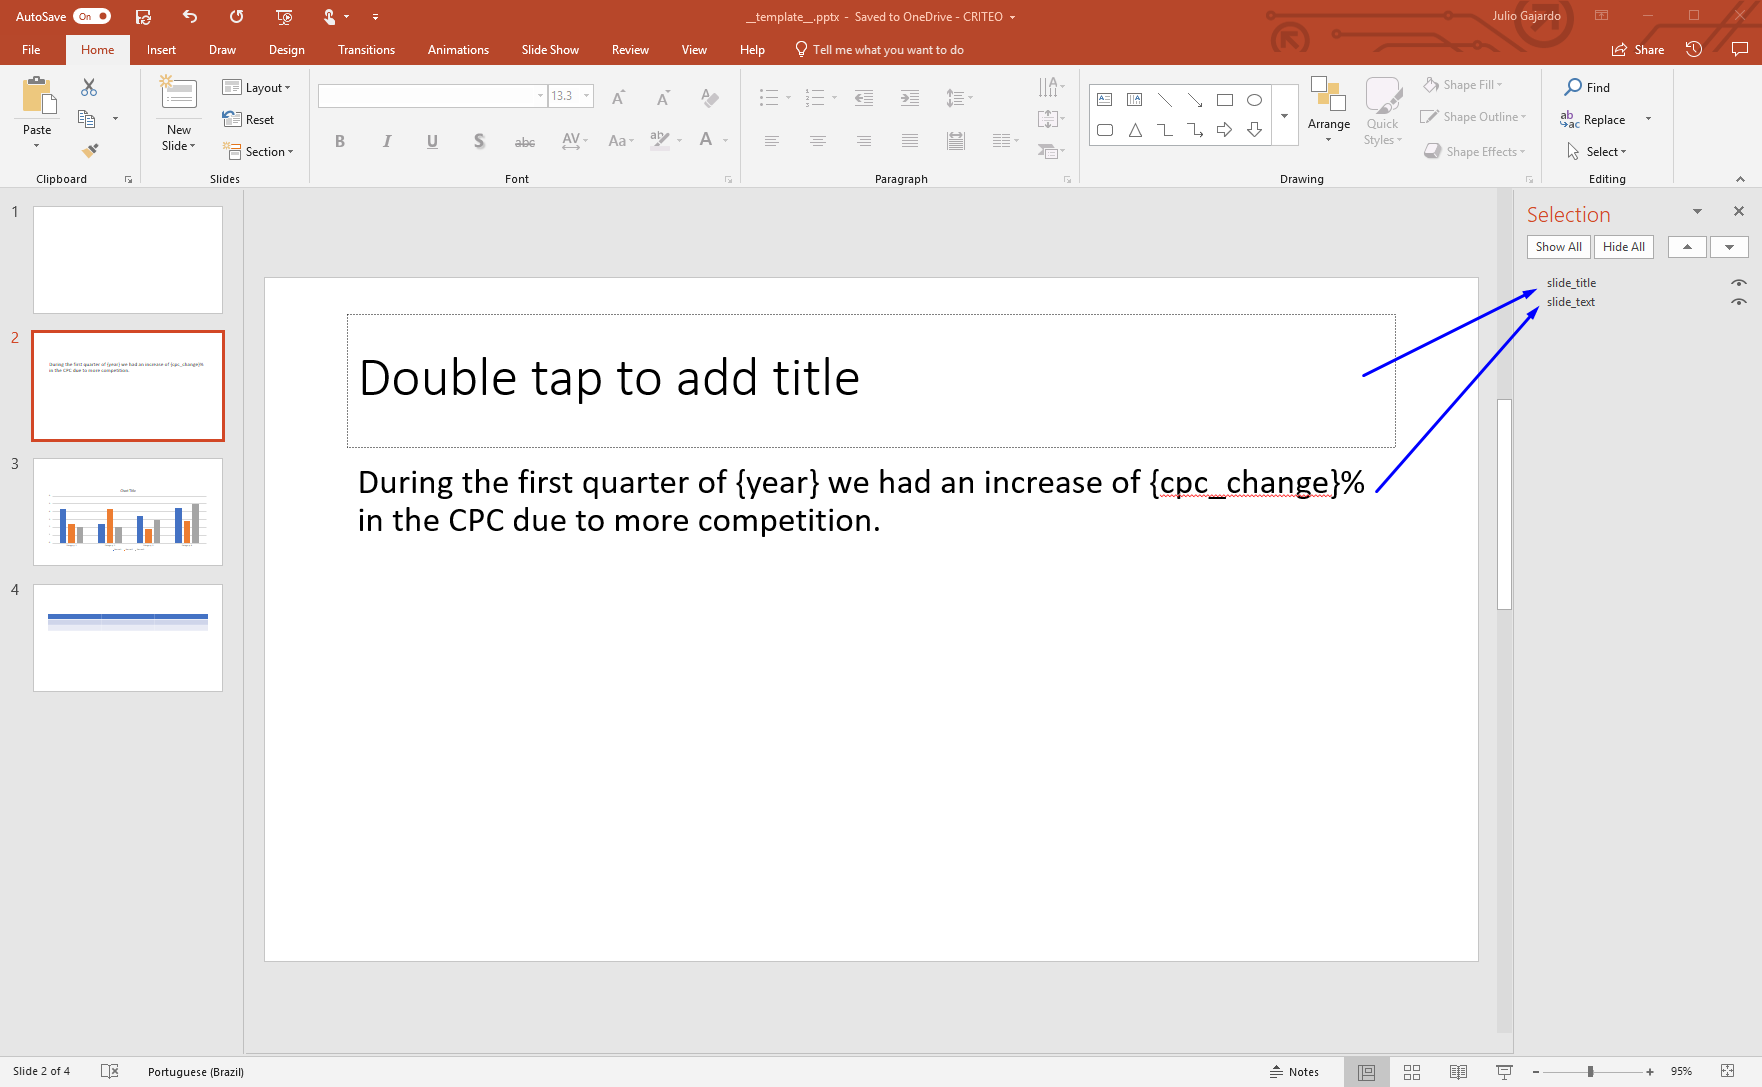
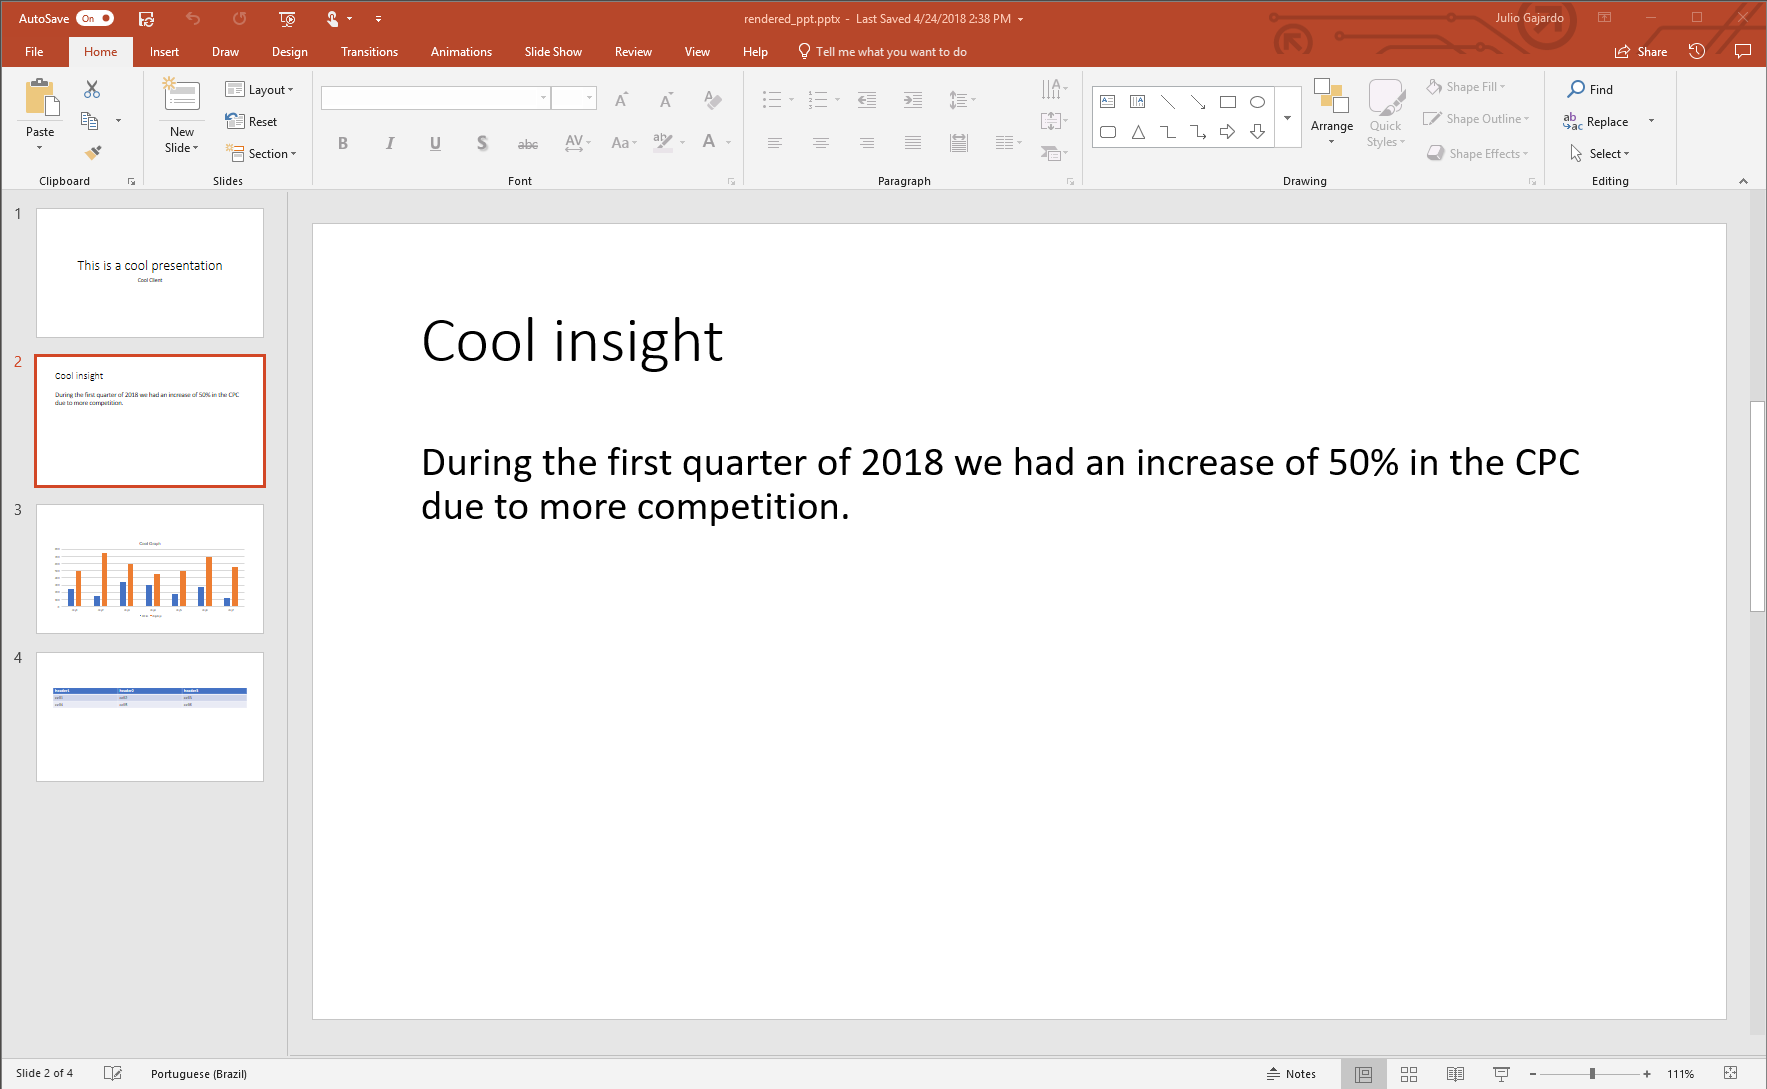
How to render placeholders within a paragraph
If you want to render placeholders within the paragraph, the value of the dictionary has to be another dictionary, with the placeholders as keys, and the text to be replaced as values. The placeholder name has to be a valid python variable name.
Code:
>>> values = {
...     'slide_text': {
...         'year': 2018,
...         'cpc_change': 50
...     }
... }

>>> render_and_save_template('__template__.pptx', values, 'rendered_ppt.pptx')
Output
How to render a table
Template
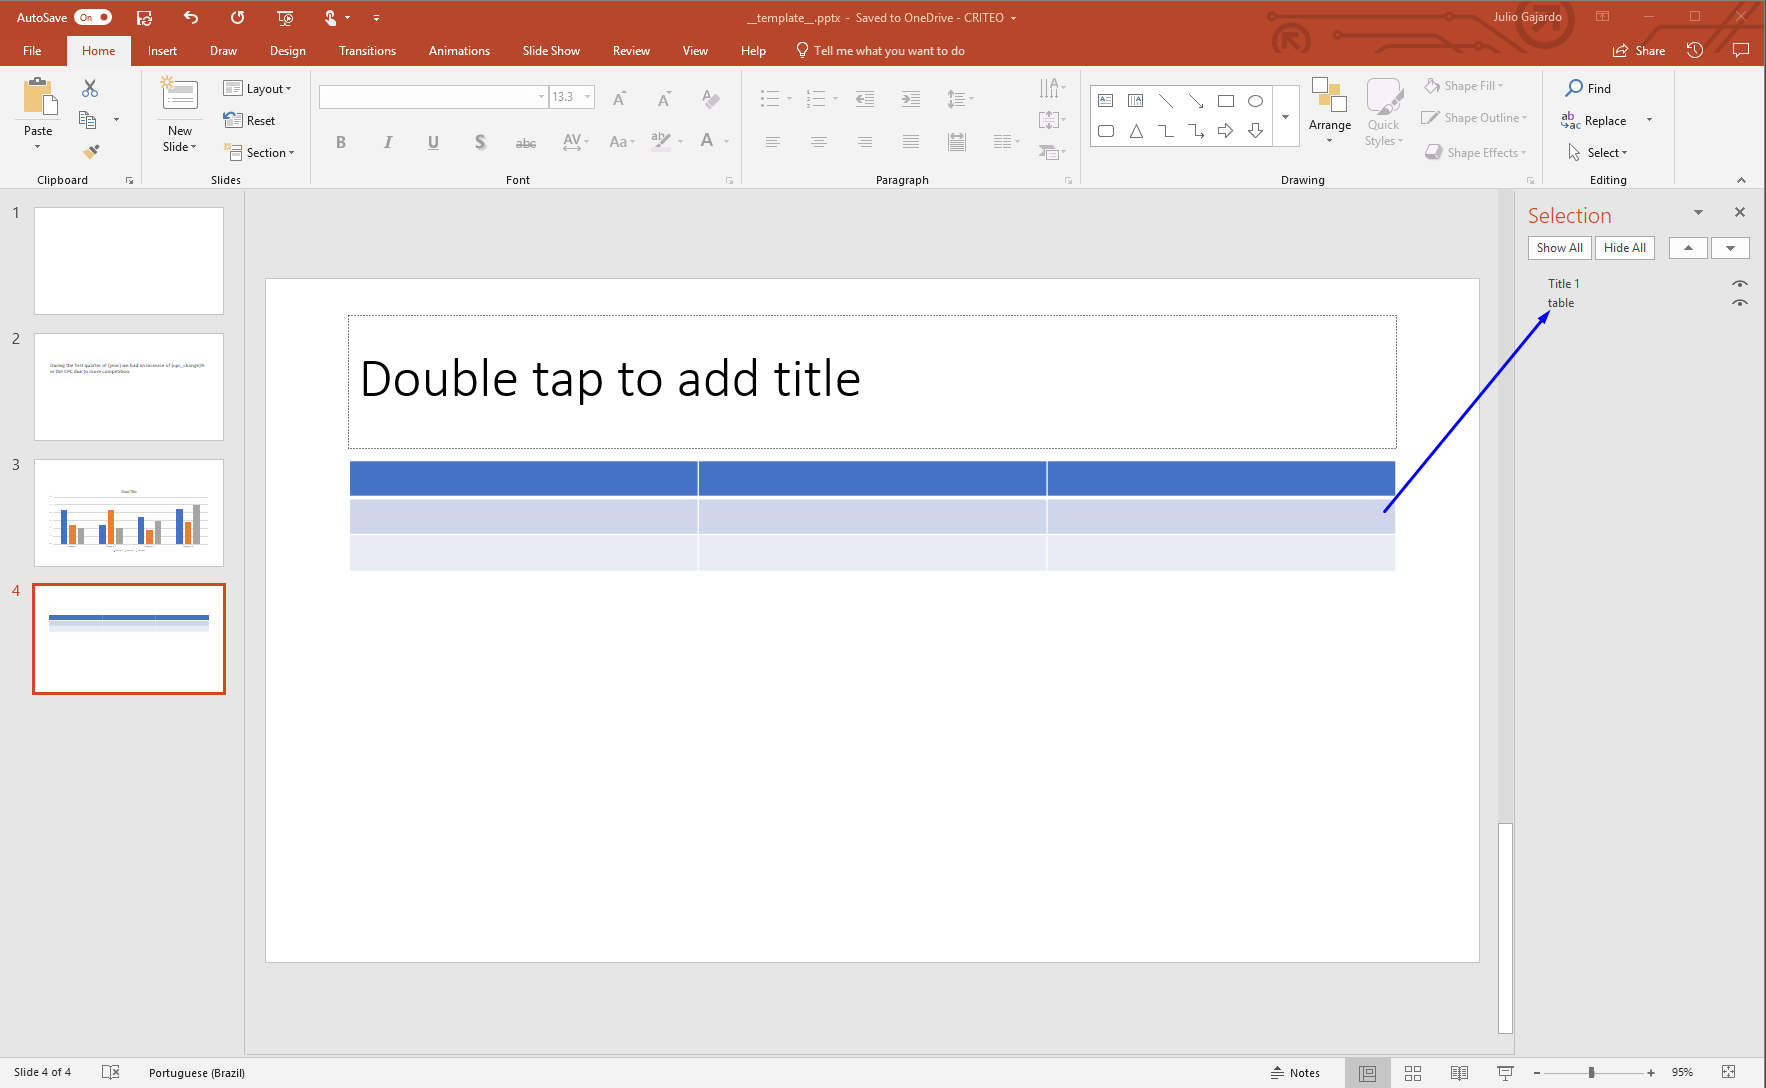
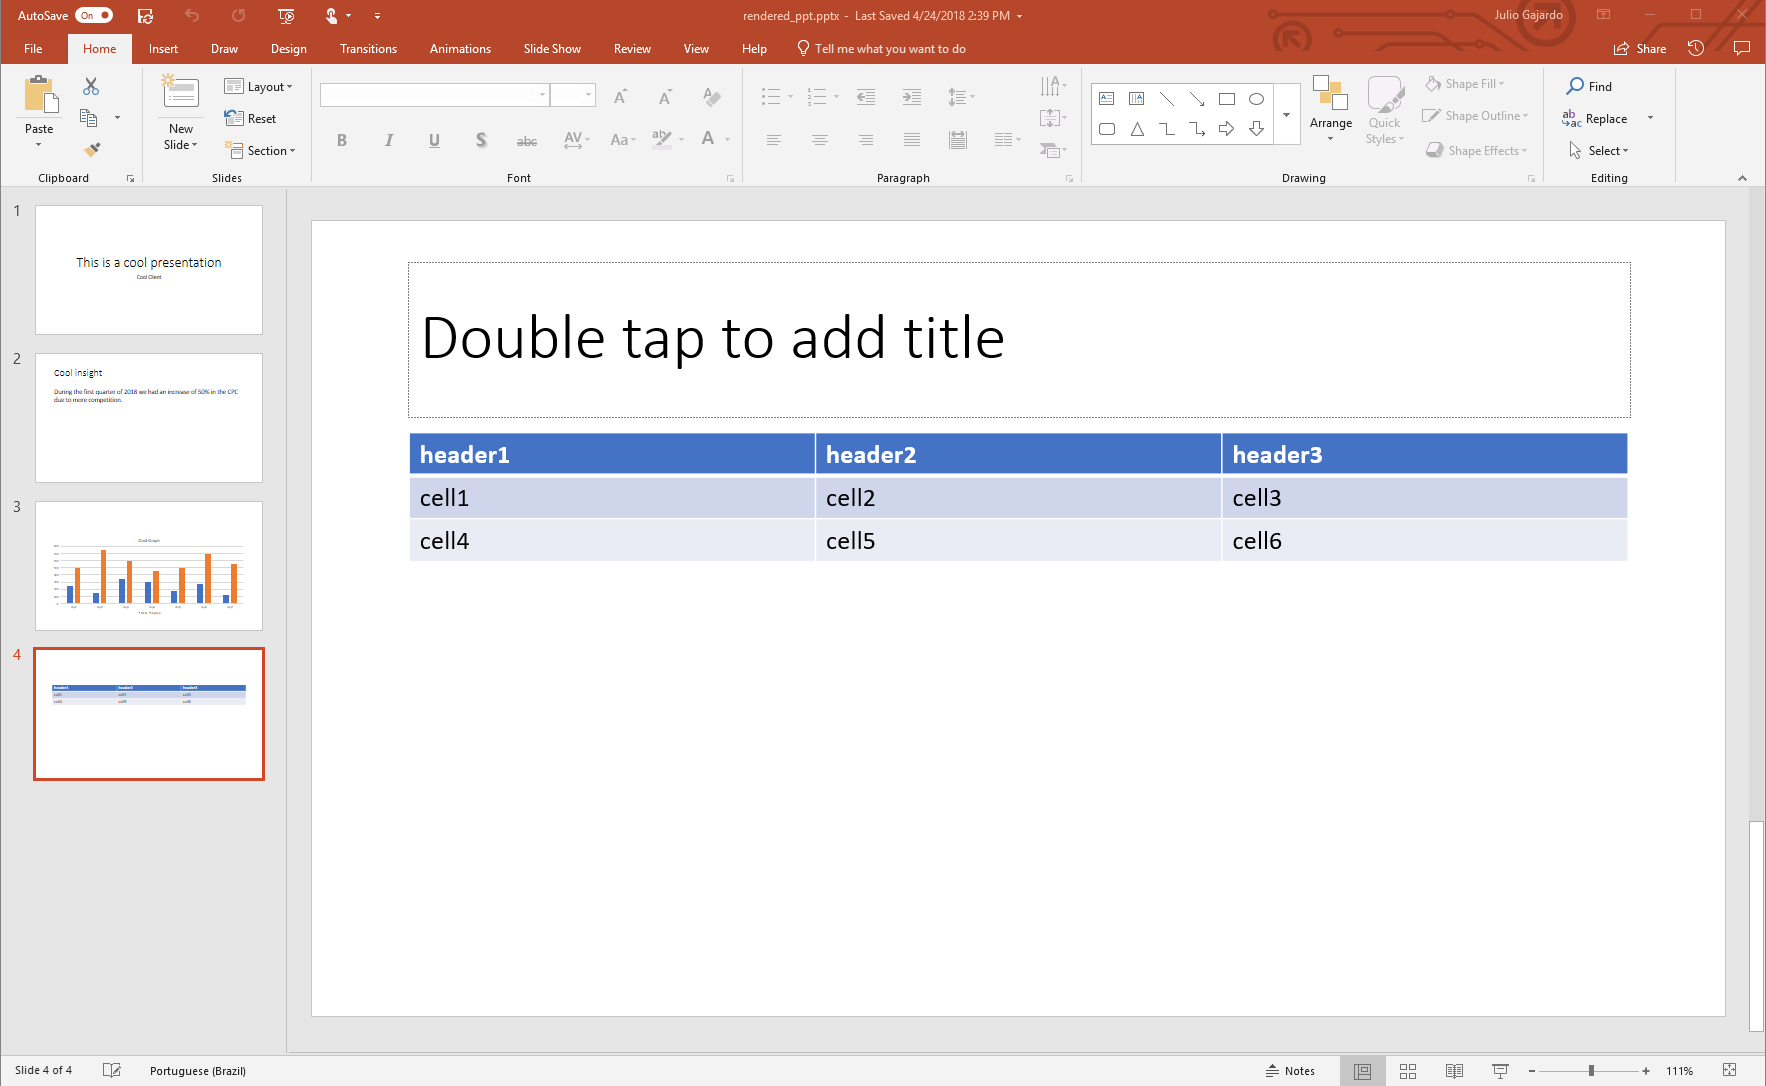
How to render a table from a python list
In order to render a table, just pass the value of each cell as a list of lists.
Code:
>>> values = {
...     'table': [
...         ['header1', 'header2', 'header3'],
...         ['cell1', 'cell2', 'cell3'],
...         ['cell4', 'cell5', 'cell6']
...     ]
... }

>>> render_and_save_template('__template__.pptx', values, 'rendered_ppt.pptx')
How to render a table from a pandas DataFrame
In the case you want to render the values of a DataFrame in the table, just pass the DataFrame instead of the list of lists.
Code:
>>> data = [
...     ['header', 'header2', 'header3'],
...     ['cell1', 'cell2', 'cell3'],
...     ['cell4', 'cell5', 'cell6']
... ]

>>> table_df = pd.DataFrame(data)
>>> table_df

    col1     col2     col3
0   header1  header2  header3
1   cell1    cell2    cell3
2   cell4    cell5    cell6

>>> values = {'table': table_df}
>>> render_and_save_template('__template__.pptx', values, 'rendered_ppt.pptx')
How to render a table from a pandas DataFrame using the header
If you want to use the DataFrame’s column names as header, you should set the header attribute to True
Code:
>>> data = [
...     ['cell1', 'cell2', 'cell3'],
...     ['cell4', 'cell5', 'cell6']
... ]

>>> table_df = pd.DataFrame(data, columns=['header', 'header2', 'header3'])
>>> table_df

    header1  header2  header3
0   cell1    cell2    cell3
1   cell4    cell5    cell6

>>> table_df.header = True
>>> values = {'table': table_df}
>>> render_and_save_template('__template__.pptx', values, 'rendered_ppt.pptx')
Output
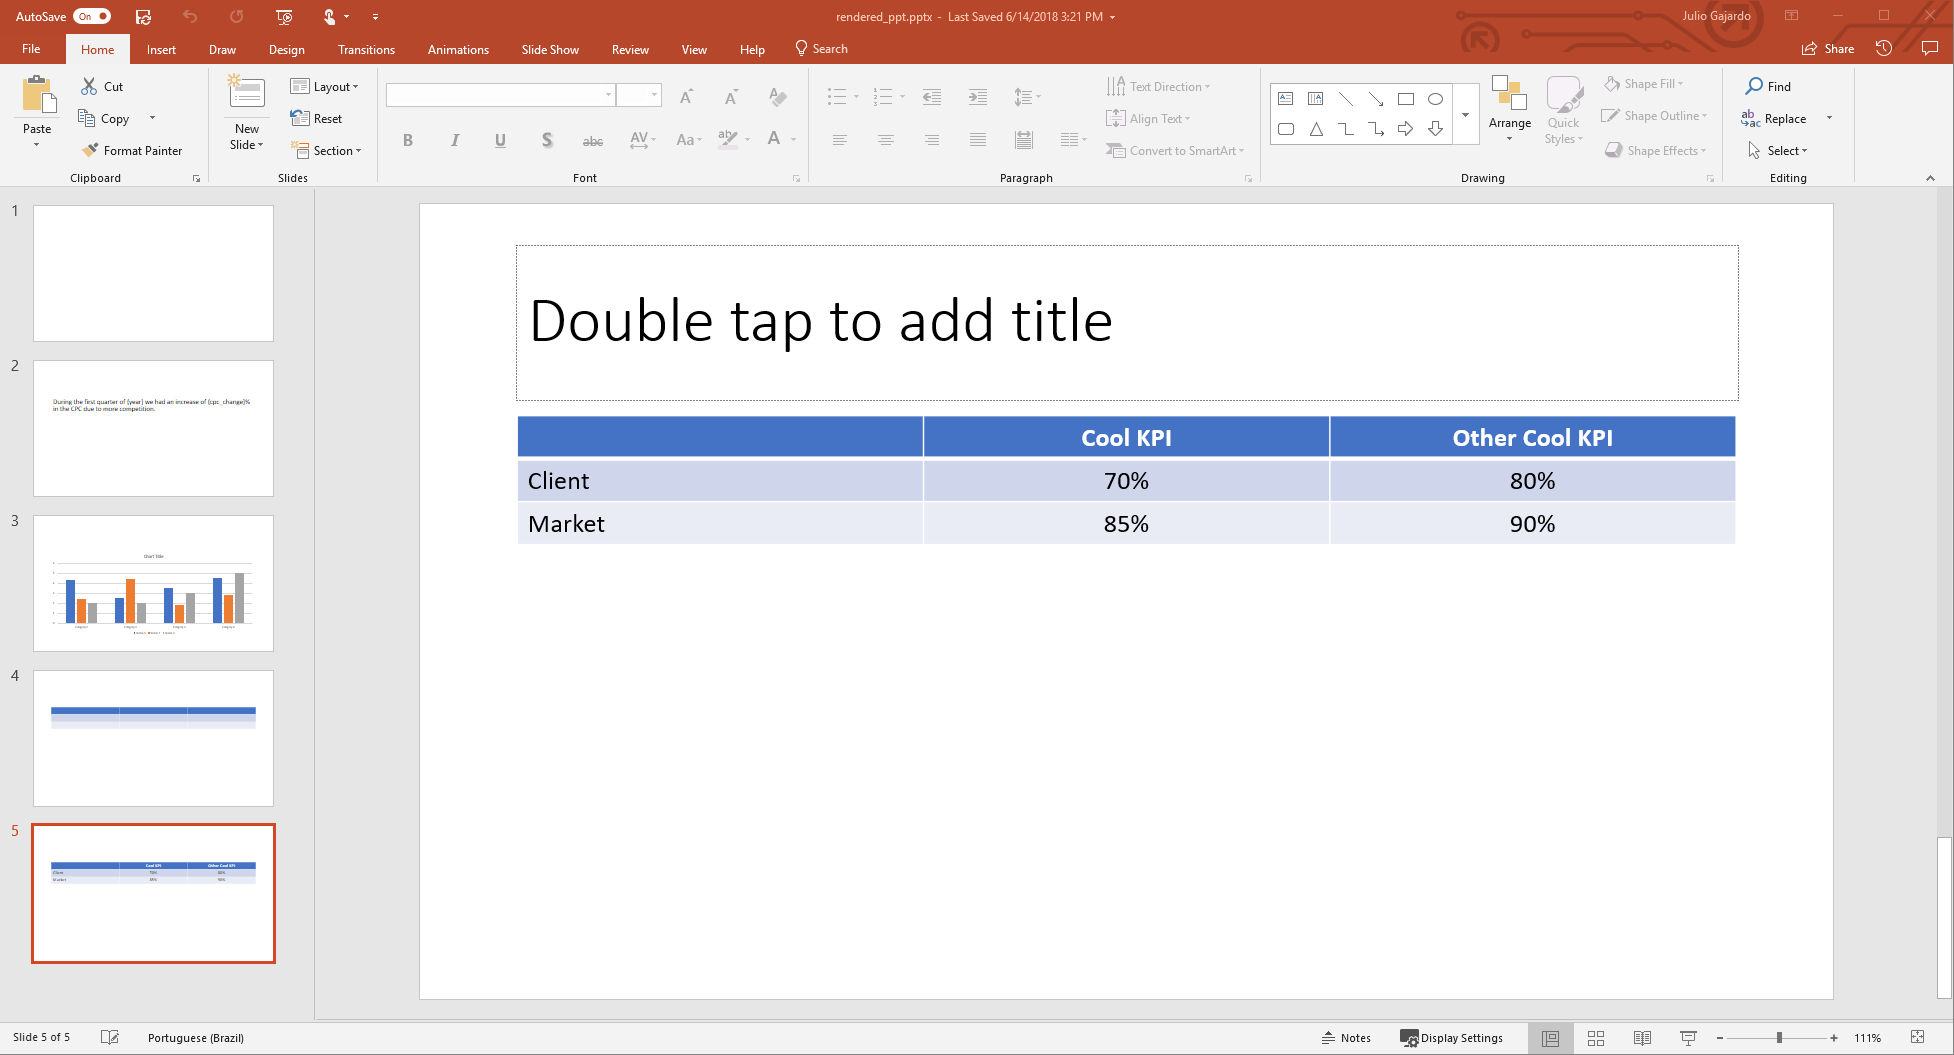
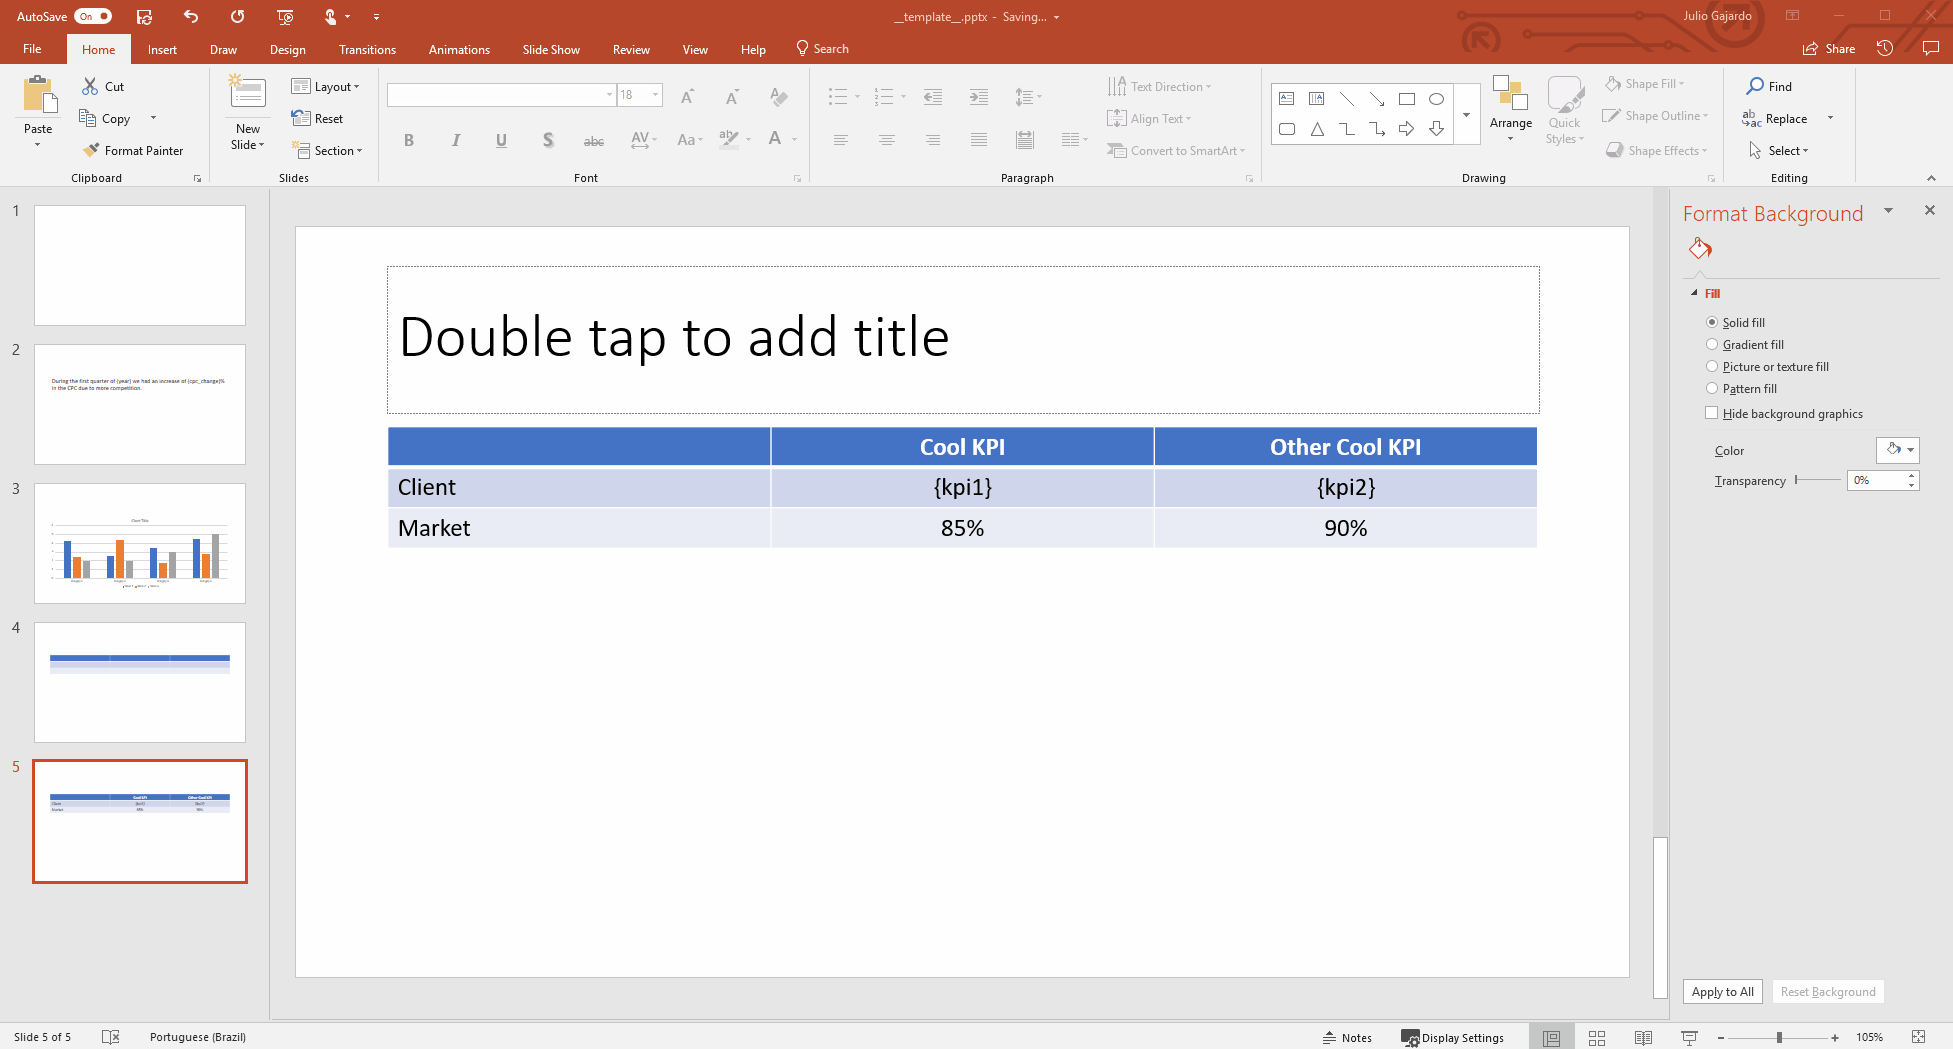
How to render parts of a table using placeholders and a python dictionary
If you want to render partially a table, for example with some KPI’s values, you can use a python dictionary.
Template
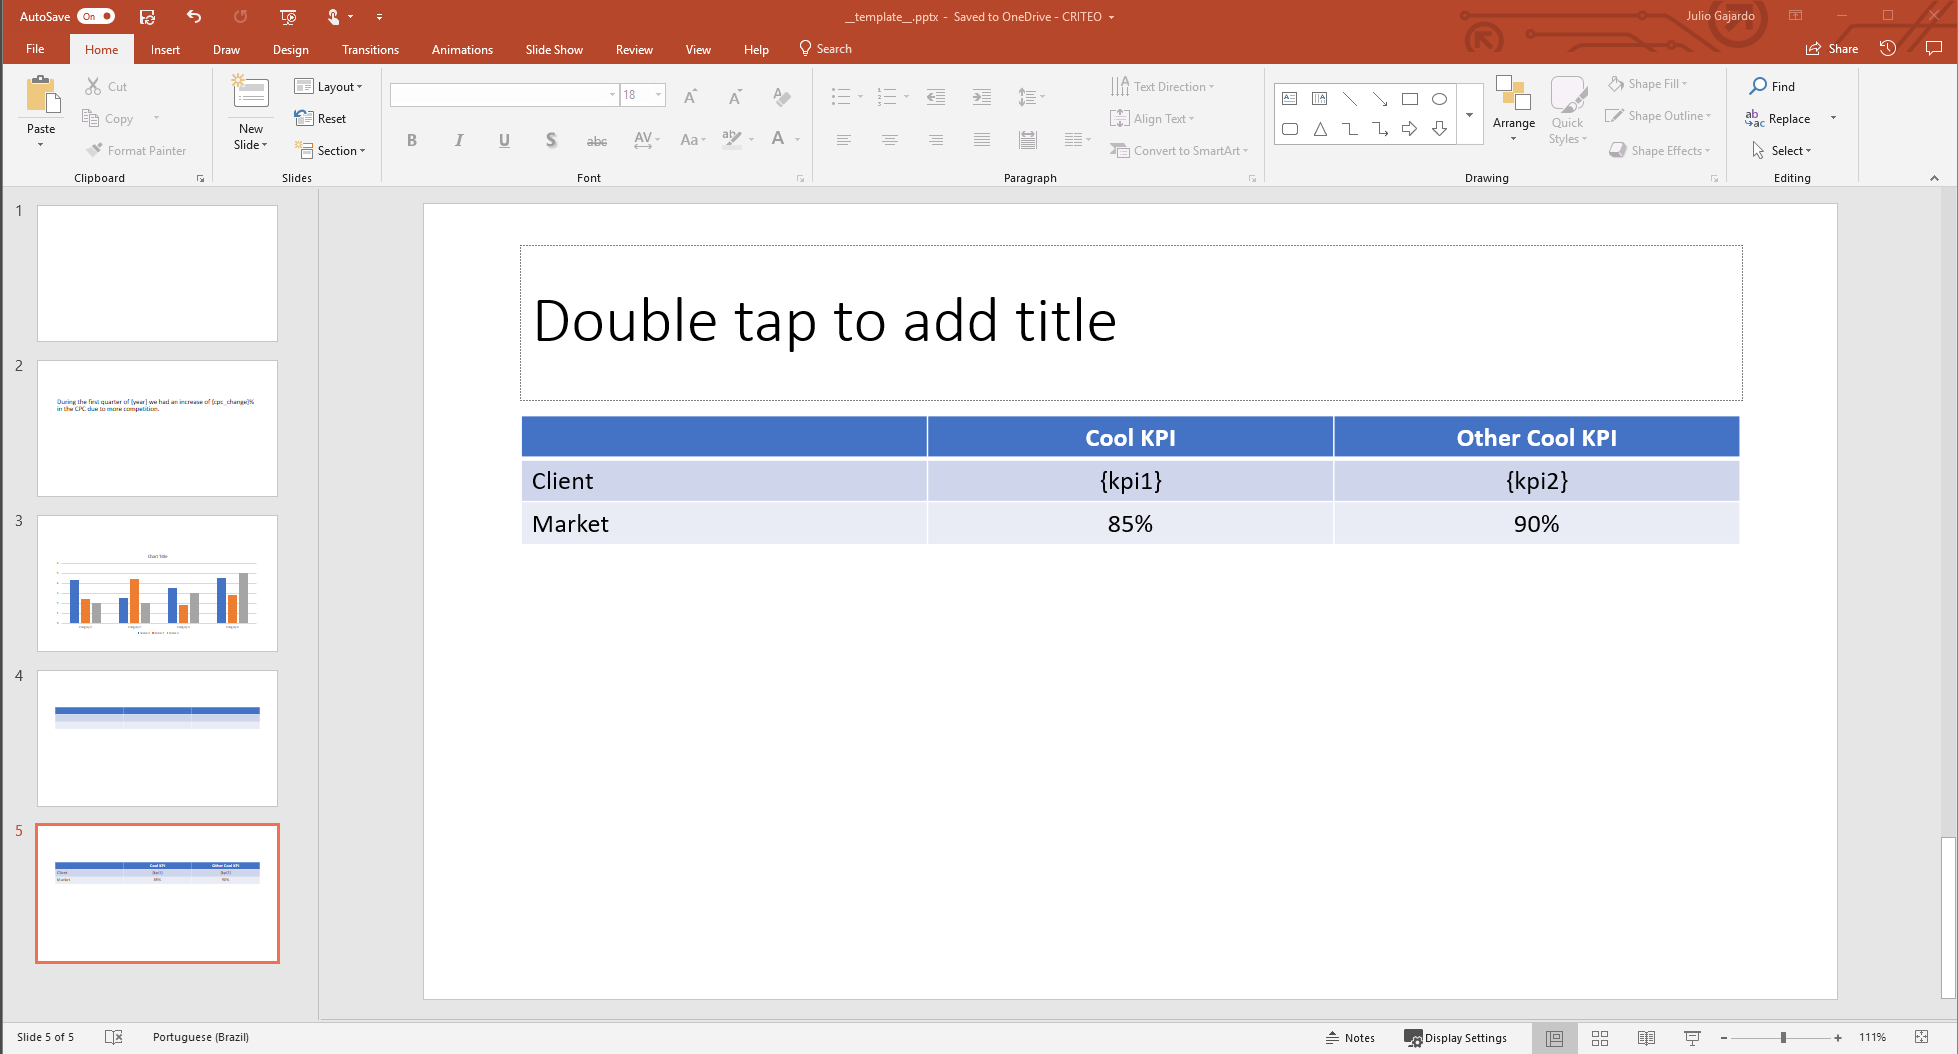
Code:
>>> values = {
...    'table': {
...        'kpi1': "70%",
...        'kpi2': "80%"
...     }
... }


>>> render_and_save_template('__template__.pptx', values, 'rendered_ppt.pptx')
Output
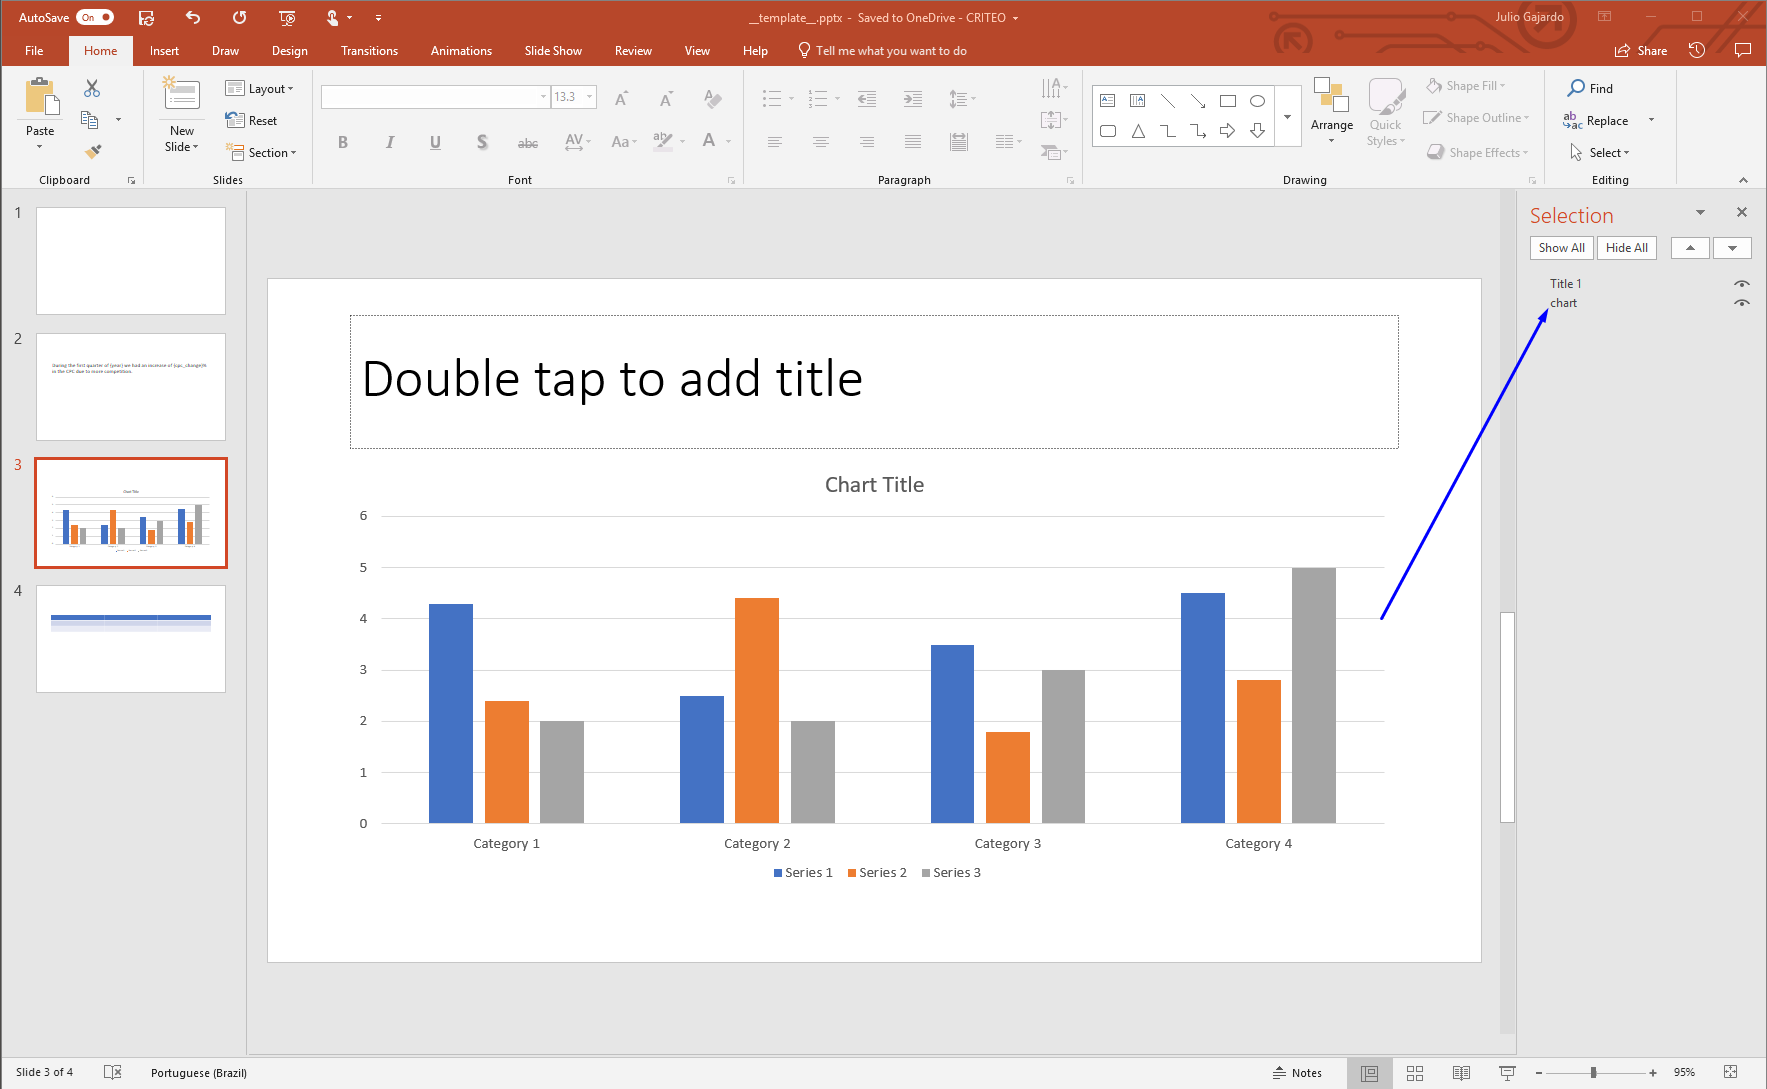
How to render charts
Template
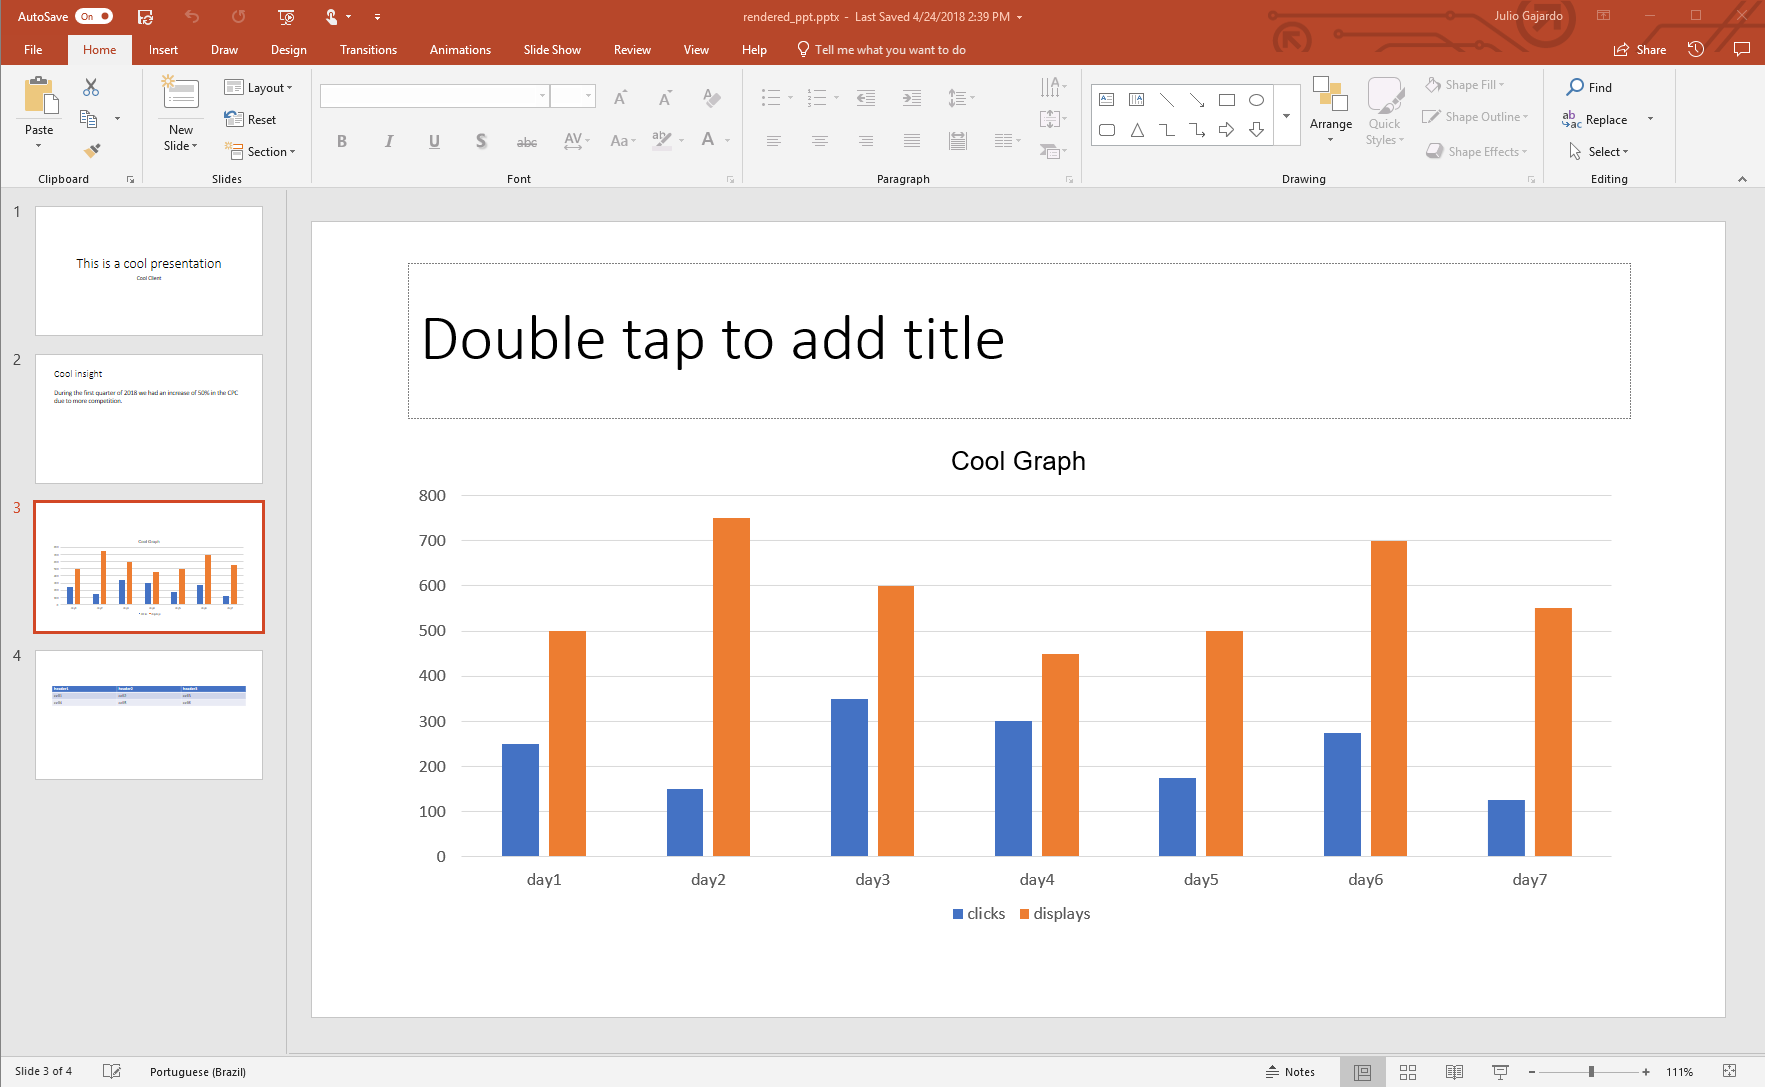
How to render a chart from a python dictionary
In order to render a chart, you need to give a dictionary with three elements, the title, the data and the categories. The data is itself another dictionary, with the name of the series as the key and values of the series as the value. Code:
>>> values = {
...     'chart': {
...         'title': "Cool Graph",
...         'data': {
...             'displays': [500, 750, 600, 450, 500, 700, 550],
...             'clicks': [250, 150, 350, 300, 175, 275, 125]
...         },
...         'categories': ['day1', 'day2', 'day3', 'day4', 'day5', 'day6', 'day7']
...     }
... }

>>> render_and_save_template('__template__.pptx', values, 'rendered_ppt.pptx')
How to render a chart from a pandas DataFrame
You can also build a chart from a DataFrame, the column names will be used as the series names, the values as it values
and the index as the categories, if you want to set the title, you should add the attribute title to the DataFrame.
Code:
>>> data = [
...     [250, 500],
...     [150, 750],
...     [350, 600],
...     [300, 450],
...     [175, 500],
...     [275, 700],
...     [125, 550],
... ]

>>> pd_chart = pd.DataFrame(data,
...                         index=['day1', 'day2', 'day3', 'day4', 'day5', 'day6', 'day7'],
...                         columns=['clicks', 'displays'])

>>> pd_chart
  clicks  displays
0    250       500
1    150       750
2    350       600
3    300       500
4    175       500
5    275       700
6    125       550

>>> pd_chart.title = "Cool Graph"
>>> values = {
...     'chart': pd_chart
... }
>>> render_and_save_template('__template__.pptx', values, 'rendered_ppt.pptx')
Output
How to format a piechart to display percentages
How to render a picture
To render a picture, you should add one to your template, this image will be replaced by the selected one as described below:
Template
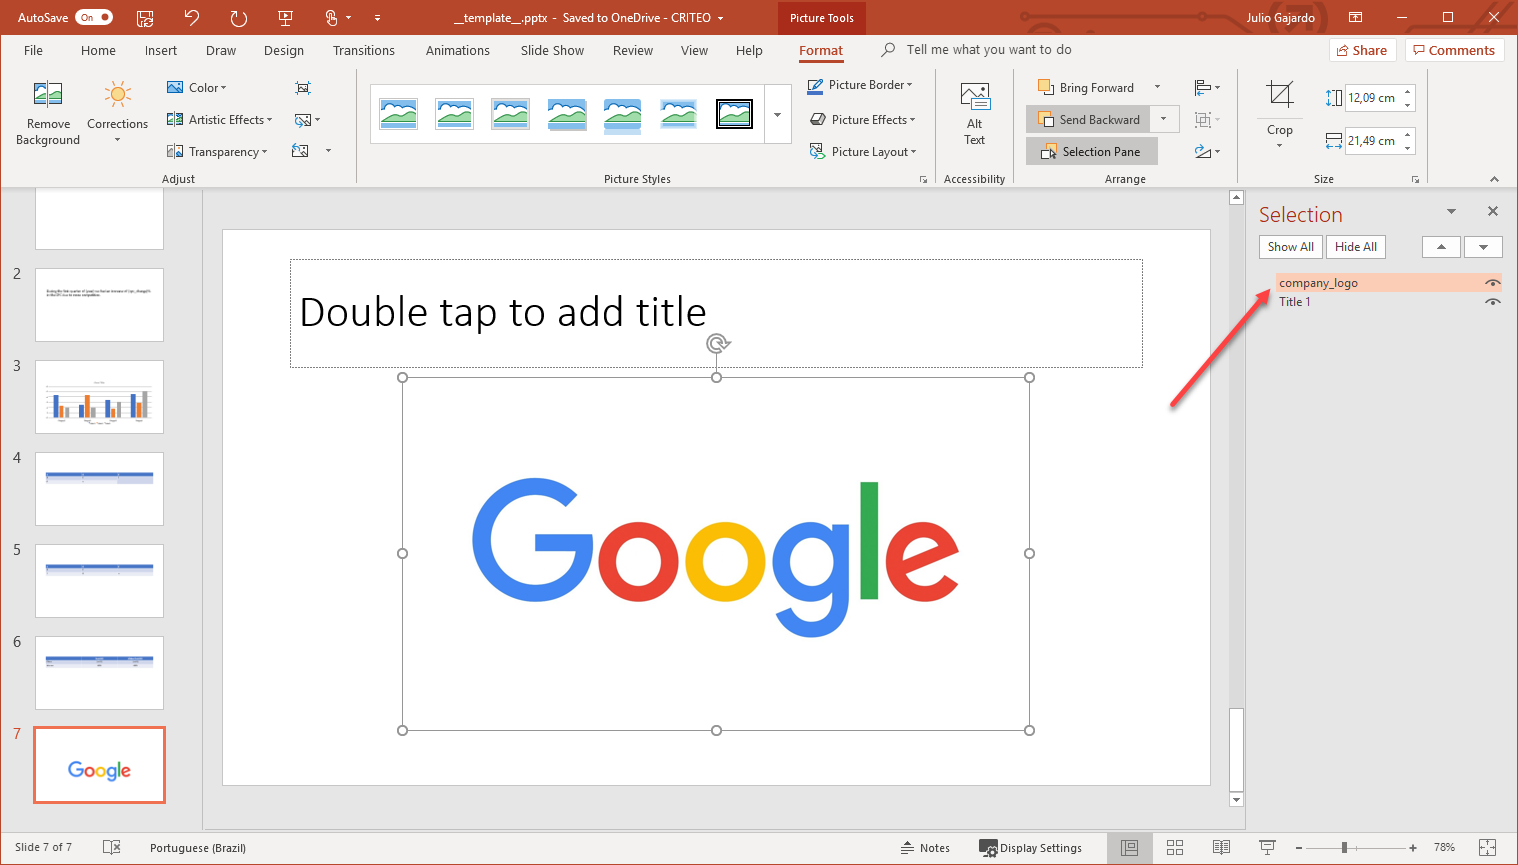
How to render a picture using a file name
To render from a filename, you just need to give the name of the image file to replace as a string.
>>> values = {
...    'company_logo': 'criteo_logo.png'
...    }
>>> render_and_save_template('__template__.pptx', values, 'rendered_ppt.pptx')
How to render a picture using a file-like object
To render from a file-like object, you just need to pass the object.
>>> import io
>>> with open('criteo_logo.png', 'br') as file:
>>>    picture = io.BytesIO(file.read())
>>> values = {
...     'company_logo': picture
... }
>>> render_and_save_template('__template__.pptx', values, 'rendered_ppt.pptx')
Output
How to render a whole presentation
In case you’re wondering, you don’t need to render one shape at the time. If you have a template like the previous one, you can render all the shapes with the following code:
>>> values = {
...     'slide_title': "Cool insight",
...     'slide_text': {
...         'year': 2018,
...         'cpc_change': 50
...     }
...     'table': [
...         ['header1', 'header2', 'header3'],
...         ['cell1', 'cell2', 'cell3'],
...         ['cell4', 'cell5', 'cell6']
...     ]
...     'chart': {
...         'title': "Cool Graph",
...         'data': {
...             'displays': [500, 750, 600, 450, 500, 700, 550],
...             'clicks': [250, 150, 350, 300, 175, 275, 125]
...         },
...         'categories': ['day1', 'day2', 'day3', 'day4', 'day5', 'day6', 'day7']
...     }
... }

>>> render_and_save_template('__template__.pptx', values, 'rendered_ppt.pptx')